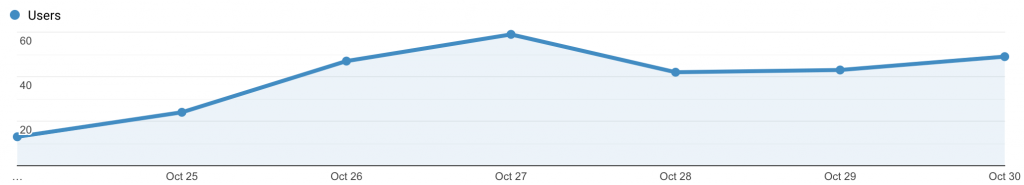
Date Range: October 24 – 30, 2020
Audience Overview:
-
-
- Visitors: 245
- Sessions: 314
- Number of Sessions/User: 1.28
- Pageviews: 1,575
- Pages/Session: 5.02
- Avg Session Duration: 3:18
- Bounce Rate: 38.54%
-
Demographics:
United States
-
-
-
- U.S. based visitors – 98%
- New York State visitors – 88%
- Other notable states – LA, NC, TX, FL, GA
-
-
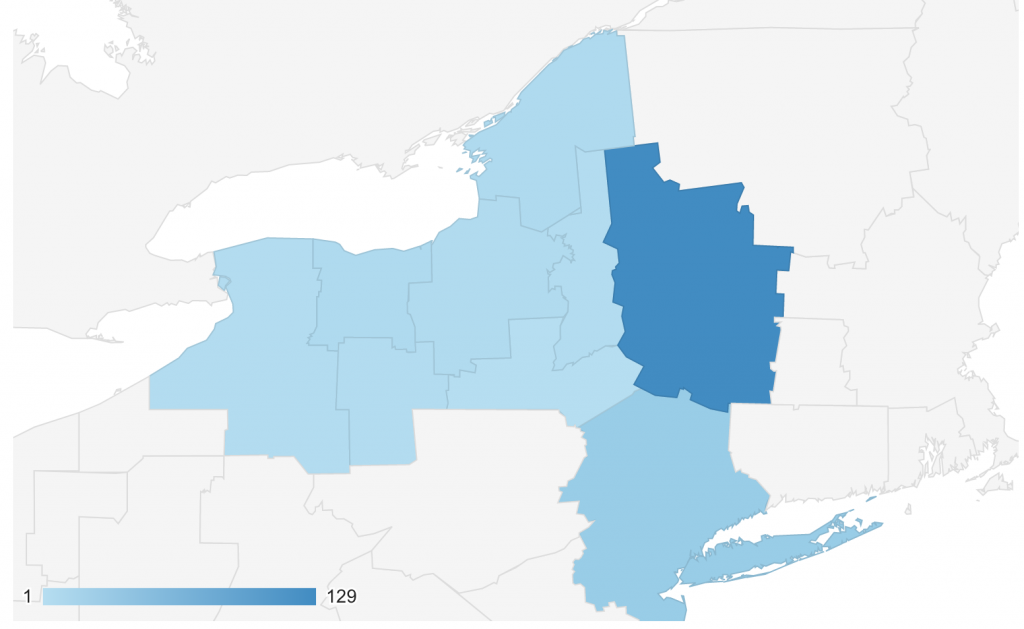
New York Regions
-
-
-
- Capital Region – 61%
- NYC/LI – 13%
- Unknown – 10%
- Rochester – 4%
- Syracuse – 3%
- Watertown – 3%
- Utica – 2%
- Buffalo – 2%
- Binghamton – 2%
- Elmira – 2%
-
-
Desktop vs. Mobile:
-
- Desktop – 90%
- Mobile – 9%
- Tablets – <1%
Browsers:
-
- Chrome – 80%
- Safari – 11%
- MS Edge – 8%
- Firefox – 1%
Traffic:
-
- Direct – 56%
- Search – 34%
- Referral – 9%
Top Pages:
-
- Home – 307 pageviews (19.5%)
- Grades K-2 – 191 pageviews (12%)
- Grades 3-5 – 165 pageviews (10.5%)
- Grades 6-8 – 67 pageviews (4%)
- Planning for Online Instruction – 43 pageviews (3%)