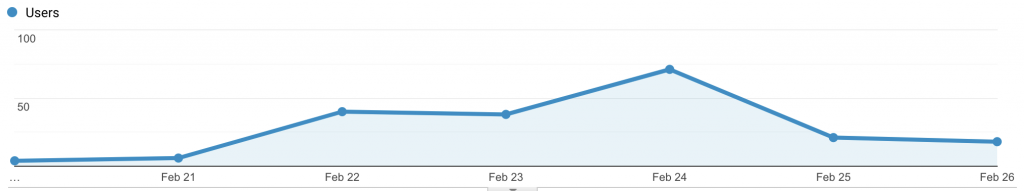
Date Range: February 20 – 26, 2021
Audience Overview:
-
-
- Visitors: 183
- Sessions: 211
- Number of Sessions/User: 1.15
- Pageviews: 752
- Pages/Session: 3.56
- Avg Session Duration: 1:54
- Bounce Rate: 31.28%
-
Demographics:
United States
-
-
-
- U.S. based visitors – 98%
- New York State visitors – 93%
- Other notable states – NC, CA, FL, IL, ME
-
-
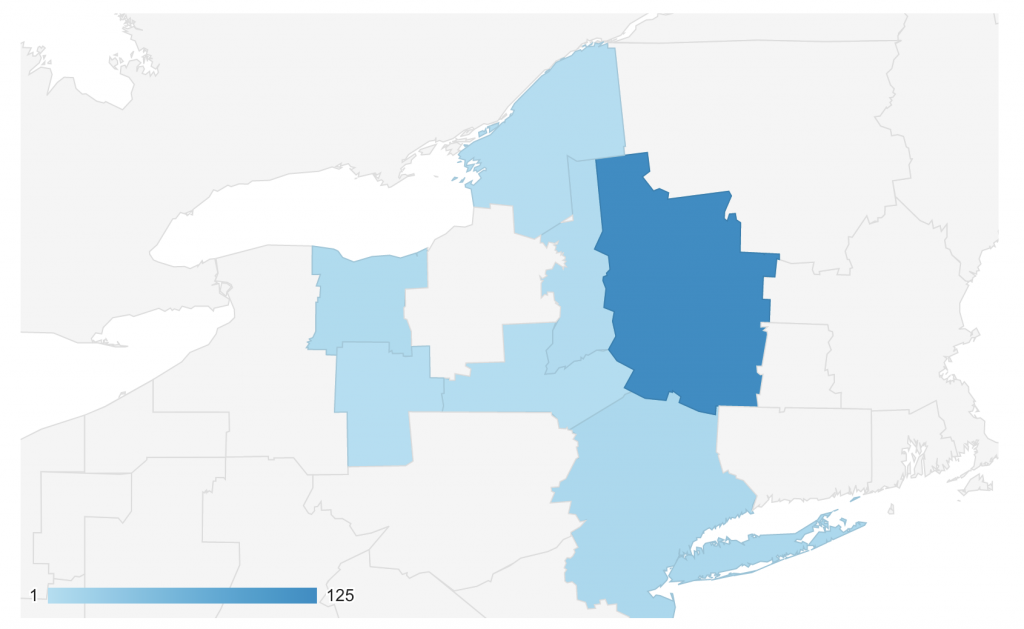
New York Regions
-
-
-
- Capital Region – 75%
- Unknown – 8%
- NYC/LI – 6%
- Rochester – 3.5%
- Utica – 3%
- Binghamton – 2%
- Watertown – 1%
- Elmira – <1%
-
-
Desktop vs. Mobile:
-
- Desktop – 93%
- Mobile – 5.5%
- Tablet – 1%
Browsers:
-
- Chrome – 90%
- Safari – 5%
- MS Edge – 3%
- Internet Explorer – 1%
- Firefox – 0.5%
Traffic:
-
- Direct – 46%
- Search – 45%
- Referral – 8.5%
Top Pages:
-
- Home – 223 pageviews (30%)
- Grades K-2 – 103 pageviews (14%)
- Login – 83 pageviews (11%)
- Grades 3-5 – 82 pageviews (11%)
- Grades 6-8 – 21 pageviews (3%)